
For February 2026, I’m running a live £1,000 trading bank using the full Fortis Sports Trading portfolio.
This bank will be staked at £5 per point, following our standard risk-management approach.
Every trade, every win, and every loss will be shared publicly.
No filters. No cherry-picking. No hiding.
Why I’m Doing This
£1,000 is a realistic starting bank for many people who are new to sports trading.
It’s not pocket change.
It’s a meaningful investment.
Over the years, I’ve built a much larger personal betting bank, but that isn’t helpful for beginners trying to understand what “realistic” results actually look like.
So instead of talking in theory, I’m putting my own money on the line and showing exactly how this works in practice.
This project is about transparency and education.
What I’ll Be Sharing
Throughout February, I’ll be posting daily updates on X showing:
Profit and loss for each Fortis system
My total portfolio performance
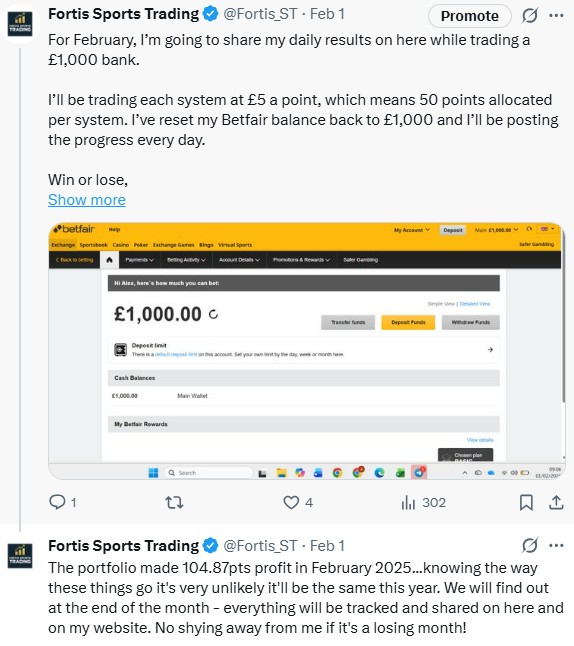
Screenshots from my Betfair account
Automated results from xCloudBot
Individual lay bets with prices matched
You’ll be able to see:
Which horses were laid
At what odds
At what time
With what outcome
These results can be compared directly to the BSP data published on our website.
Nothing is hidden.
Real Results, In Real Time
Many services only show selected results.
Some only show long-term graphs.
Others quietly remove losing periods.
That’s not how we operate.
This project shows what it’s really like to follow the Fortis portfolio:
Good runs
Bad runs
Flat periods
Growth phases
All of it.
This is what long-term sports trading actually looks like.
Bank Structure
For this project, I’m using:
Starting bank: £1,000
Points: 200
Stake per point: £5
Systems: Full Fortis portfolio
Execution: Fully automated
This is the same framework we recommend to members.
No special treatment. No altered settings.
Who This Is For
This series is ideal if you:
Are new to sports trading
Are considering joining Fortis
Want to see real-world results
Prefer evidence over promises
It’s designed to help you make an informed decision — not to convince you with hype.
Follow the Journey
I’ll be posting daily updates on X throughout February.
You can follow along here:
If you’re curious about how sports trading works in practice, this will give you a front-row seat.
The Results
Unfortunately February resulted in a very disappointing month, losing a total of (?) across the portfolio. The daily breakdown for each system is in the table below, showing results to BSP with no odds filters and suggested ranges. Also included is the automated results Alex achieved throughout the month. Every single day and selection was fully tracked on X - check out @Fortis_ST and scroll down to 1st Feb and you'll see everything. Nothing is hidden at Fortis, even when we have a bad month!
06-Feb | ||||
07-Feb | ||||
08-Feb | ||||
09-Feb | ||||
10-Feb | ||||
11-Feb | ||||
12-Feb | ||||
13-Feb | ||||
14-Feb | ||||
15-Feb | ||||
16-Feb | ||||
17-Feb | ||||
18-Feb | ||||
19-Feb | ||||
20-Feb | ||||
21-Feb | ||||
22-Feb | ||||
23-Feb | ||||
24-Feb | ||||
25-Feb | ||||
26-Feb | ||||
27-Feb | ||||
28-Feb | ||||
TOTAL |